River Geometry · DSM Analysis · EPSG:2154
Riverbank
Morphometrics
Python pipeline to automatically extract thalweg, bank toe, and bank edge from a Digital Surface Model (DSM) using centerline-based cross-sections and derivative (dZ/dX) detection — producing continuous morphological lines for hydraulic model input.
Overview
What this repo does
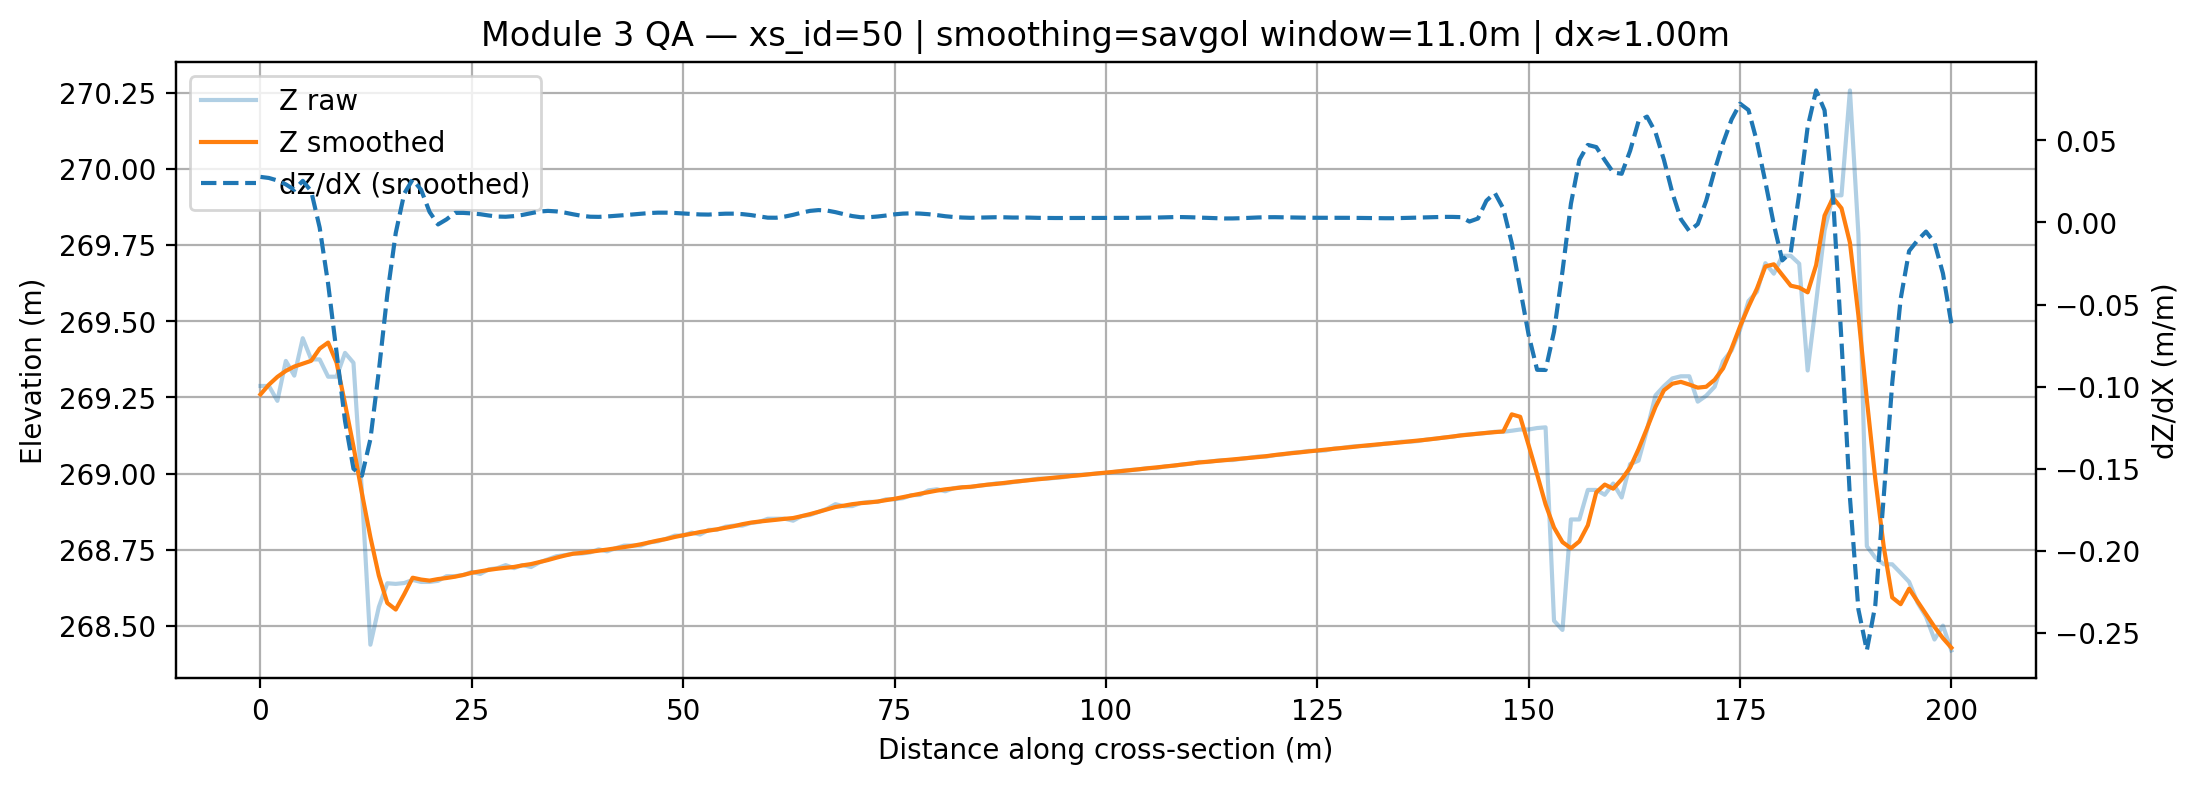
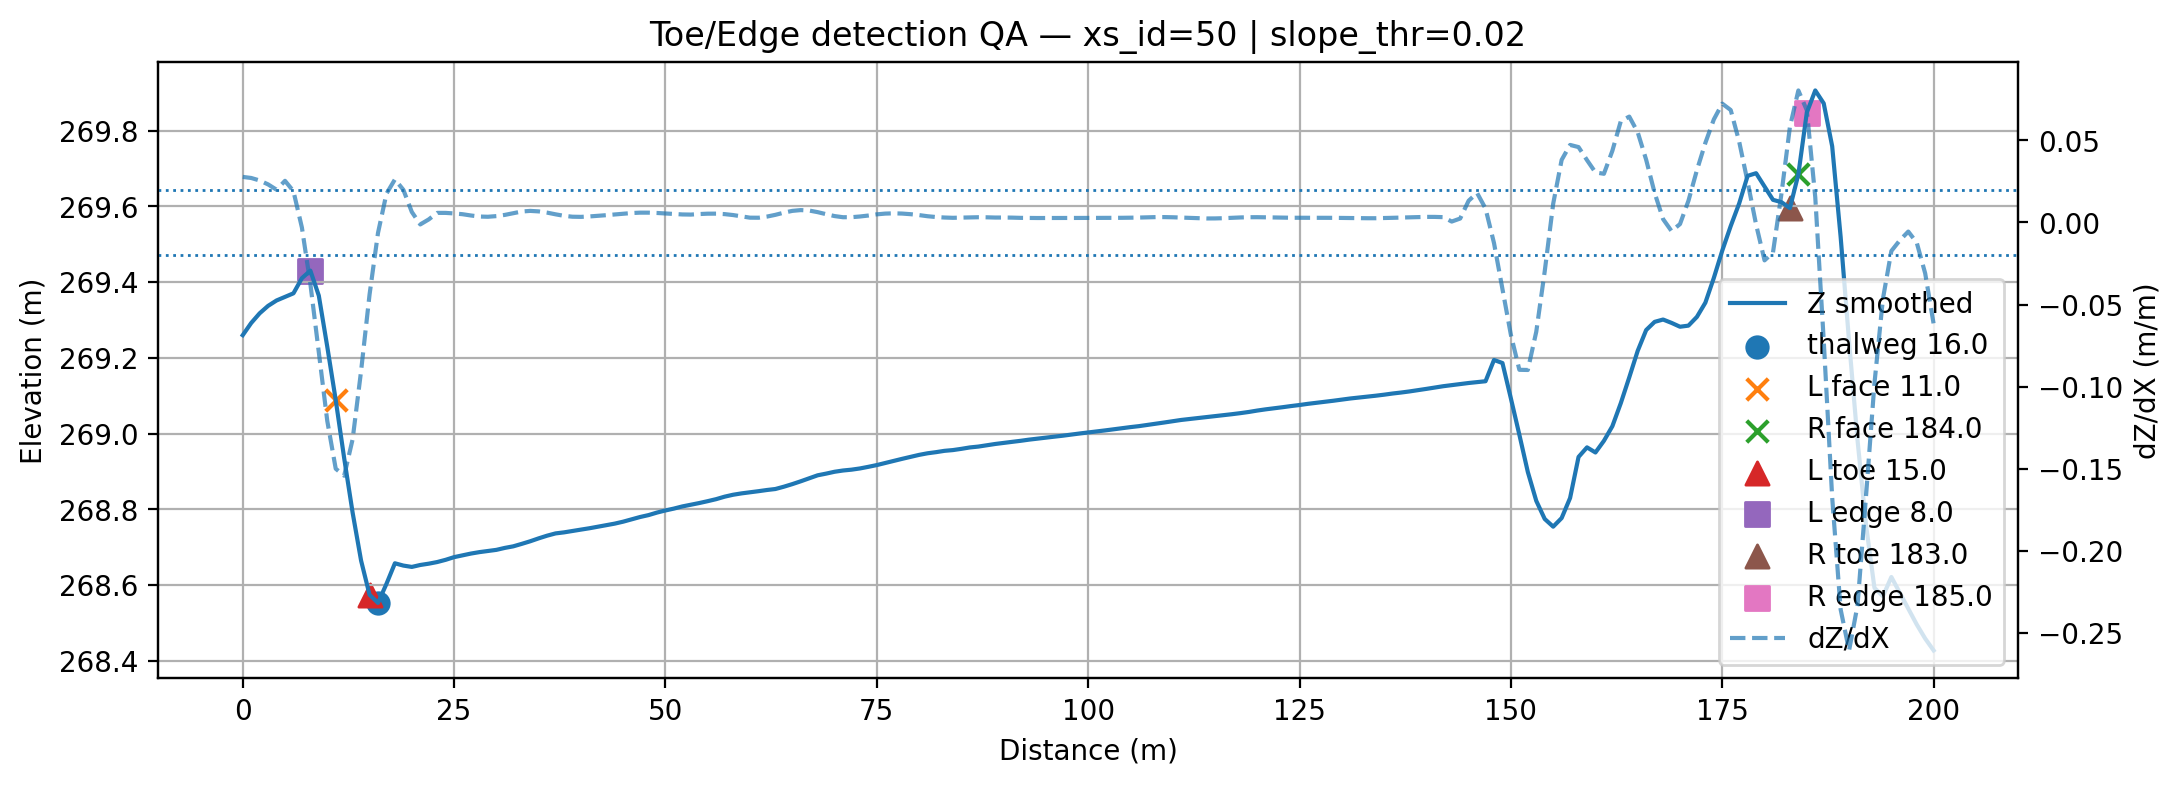
Defining a river's geometry for hydraulic modelling — the thalweg (deepest point), bank toes (where the bank meets the floodplain), and bank edges — traditionally requires manual digitising in GIS, which is slow and subjective. This pipeline automates the detection of these morphological features from a DSM using a cross-section approach: perpendicular transects are generated along the river centreline, elevation profiles are sampled and smoothed, and the first-derivative (dZ/dX) is analysed to locate break-of-slope points automatically.
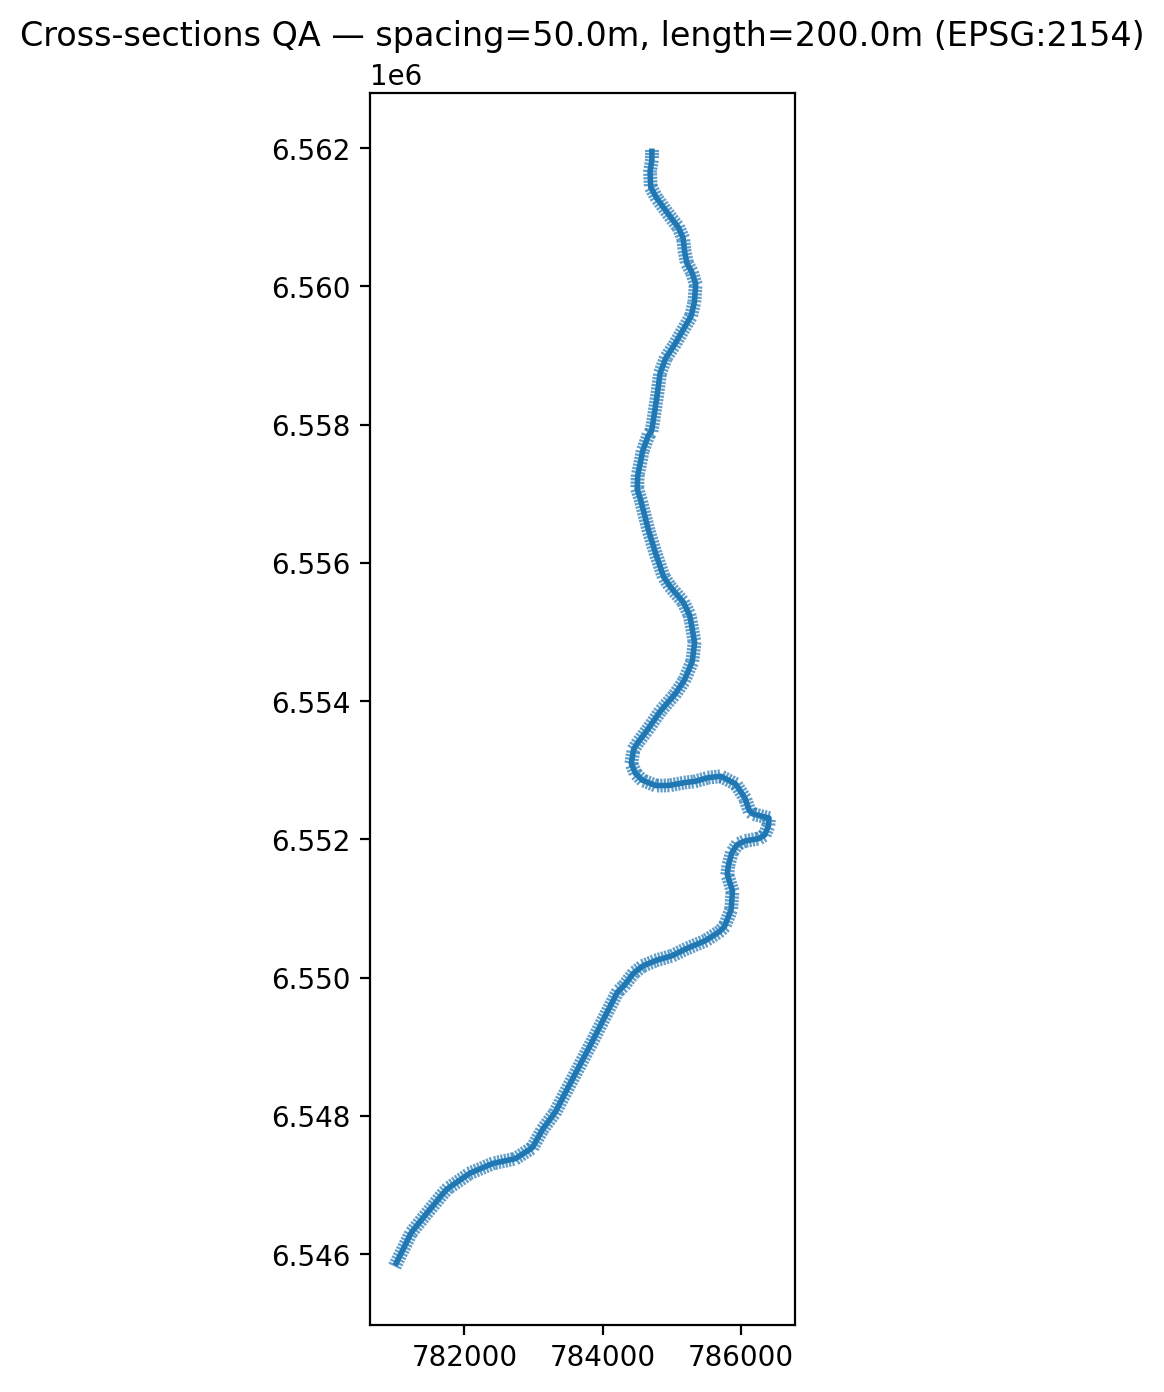
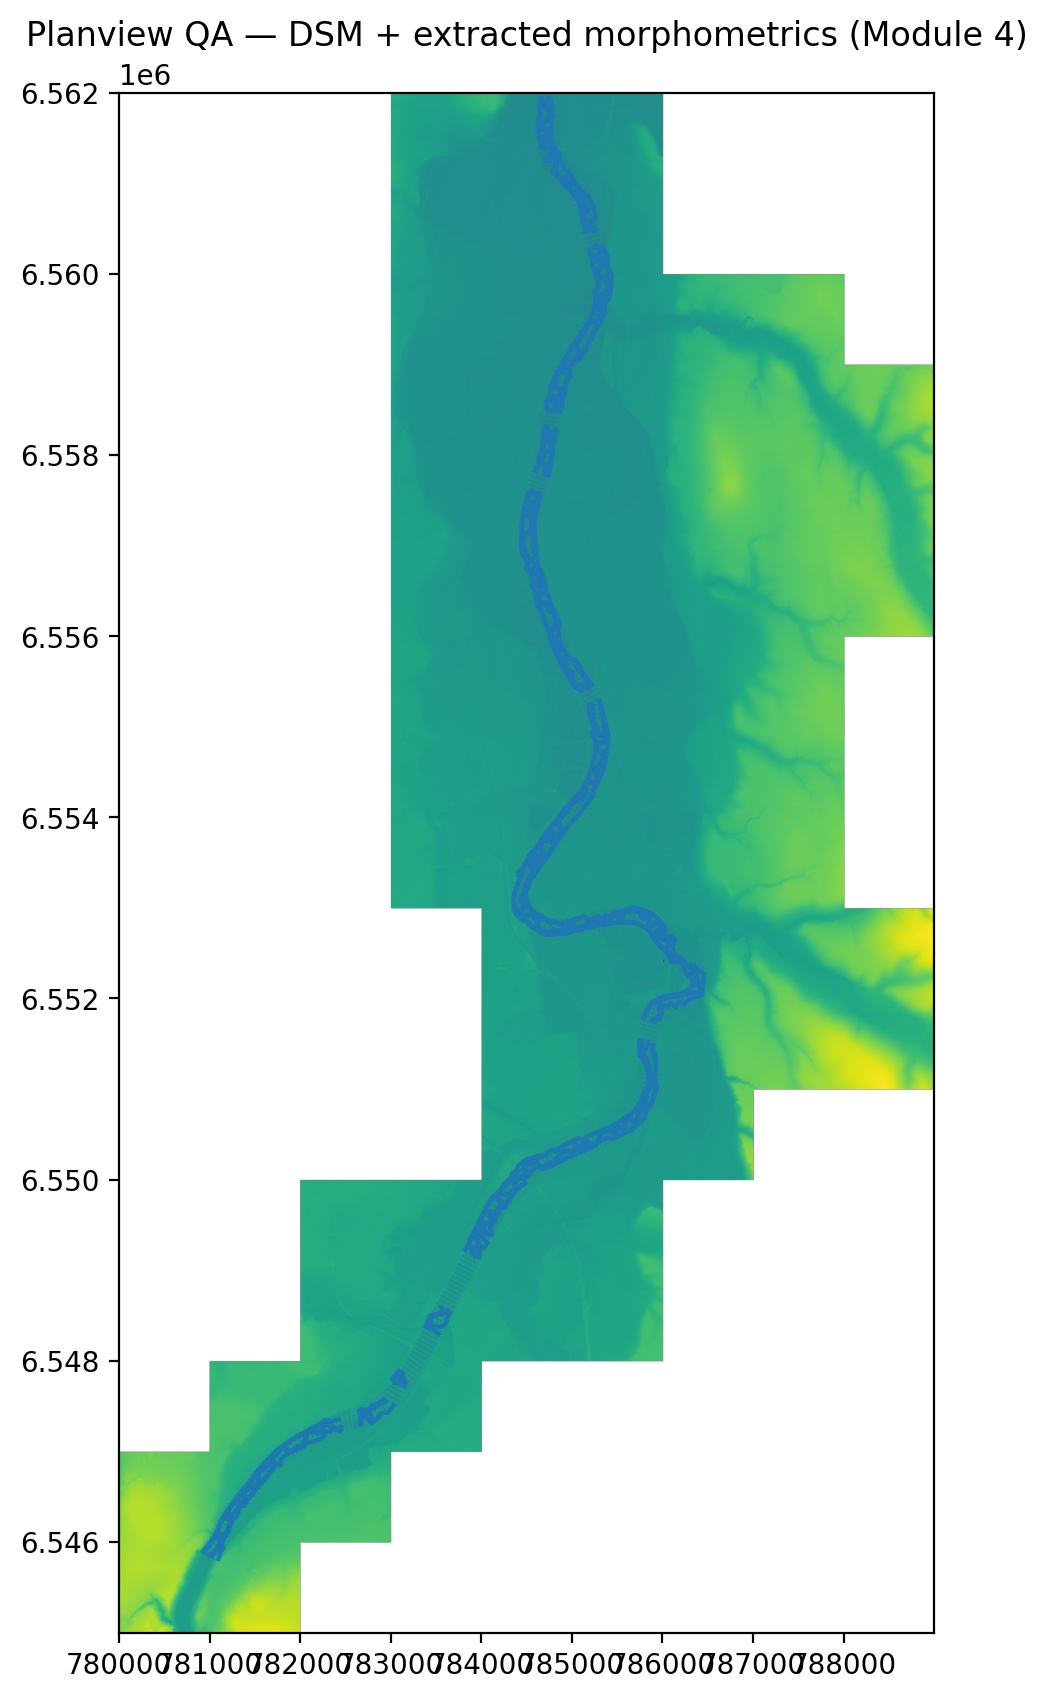
The outputs are continuous geometric lines — thalweg, left/right bank toe, left/right bank edge — ready for export into HEC-RAS geometry or further spatial analysis in QGIS. Cross-sections are spaced at 50 m with a transect length of 200 m, in EPSG:2154.
Architecture
Four-module pipeline
tools/00_check_setup.py — verify environment, dependencies, input files present.tools/01_centerline_check.py — validate centreline geometry, CRS, direction.tools/02_generate_cross_sections.py — perpendicular transects at 50 m spacing, 200 m length.tools/03_check_dsm.py — verify DSM extent covers all cross-sections, inspect NoData and resolution.tools/05_sample_all_profiles.py — sample DSM elevation along every transect, save profile arrays.tools/12_detect_features_all.py — smooth + dZ/dX + detect thalweg / left-right toe / left-right edge for all cross-sections.tools/14_build_morpho_lines.py — connect detected points into continuous line geometries.tools/15_planview_qa_plot.py — generate plan-view map of all detected lines for visual inspection.Key QA Figures
Output visualisations
Four QA figures are generated at key stages of the pipeline to validate geometry, profile sampling, feature detection, and final line outputs.
Technical Details
Stack & repository structure
├── riverbank_morpho/ ← Python package
│ ├── config.py ← paths, parameters (spacing, length, threshold)
│ ├── cross_sections.py ← Module 1: transect generation
│ ├── io_raster.py ← DSM sampling utilities
│ ├── io_vector.py ← GeoPackage read/write
│ ├── detection.py ← Module 3: dZ/dX, thalweg, toe, edge
│ └── plotting.py ← QA figure generation
├── tools/ ← entry-point scripts (run in order)
│ ├── 00_check_setup.py
│ ├── 01_centerline_check.py
│ ├── 02_generate_cross_sections.py
│ ├── 03_check_dsm.py
│ ├── 05_sample_all_profiles.py
│ ├── 12_detect_features_all.py
│ ├── 14_build_morpho_lines.py
│ └── 15_planview_qa_plot.py
├── inputs/ ← centreline shapefile + GeoPackage
├── docs/images/ ← QA figures (tracked in repo)
├── settings.ini ← user-configurable parameters
├── requirements.txt
└── README.md